Dave Petley has a very good post up on the Oso/Hazel/Steelhead Landslide that is well worth looking at it. He utilizes the better refined seismic signal, the very good images from the Governor's fly over and his many years of study and perspective on landslides. The post is blogs.agu.org/landslideblog - oso-mechanisms. I concur with his take and may add a few bits later. Having read the Landslide Blog routinely for many years it is good to read Dave's take and perspective on this horrible event.
Monday, March 31, 2014
Sunday, March 30, 2014
Eastern Washington has Landslide Hazards Too
As follow up from yesterday; I would note that landslides are by no means restricted to western Washington. Late this last week I took a look at some landslide sites in Spokane County. Unconsolidated sediments in Spokane County undermined by Latah Creek. The bluff slopes above the creek valley provides fine views, but in places where the creek is hard up against the valley wall the bluffs are undercut and shallow landslides develop.

The side of the creek has been armored with rock and/or wood cribbing, but high flow events like one this winter still reach the toe of the slope. The whole scenario is very much like many shoreline bluffs around Puget Sound.
Some of the biggest recent landslides in Washington State have been in Franklin County. Proof you do not need high mountains, glacial sediments or high rainfall to have slope failures.


Lower Latah Creek in Spokane County
The side of the creek has been armored with rock and/or wood cribbing, but high flow events like one this winter still reach the toe of the slope. The whole scenario is very much like many shoreline bluffs around Puget Sound.
Some of the biggest recent landslides in Washington State have been in Franklin County. Proof you do not need high mountains, glacial sediments or high rainfall to have slope failures.
Headwall scarp of landslide in Franklin County near Mesa
View of slide run out
This slide permanently closed a county road and altered an irrigation water route
Franklin County identified a specific unit within the Ringgold Formation as a landslide hazard area. The specific soil properties of the unit are associated with numerous very large landslide locations in Franklin County ranging from very ancient to ongoing.
I had an early morning project at another eastern Washington site and then had some excellent light to see a very large landslide block on the east end of Umtanum Ridge near Vernita.
This slide is within the highly fractured basalt associated with tight folding and faulting. The slide block likely dates to the ice age floods that swept along the lower slopes of the ridge on multiple occasions. But I would note that the alluvial fan just to the right of the rotated block has been active post ice age floods and likely based on vegetative cover on the slopes above and on the fan itself is a landslide hazard site.
Friday, March 28, 2014
One of the Oso/Hazel Landslide Lessons - Consider Your Local County

Most recent Clay Bank Landslide event on the Nooksack River
One of the big lessons from the Hazel/Oso Landslide was taken up by John Stark and Ralph Schwartz with the Bellingham Herald. They did an early article shortly after the Hazel/Oso Landslide regarding the landslide hazard in Whatcom County, Washington State (Whatcom County Has Its Share of Hazardous Slide Areas, Too). Whatcom County is two counties north of Snohomish County where the Hazel/Oso Landslide took place. And like Snohomish County has valleys that extend into the Northwest Cascades and North Cascades.
John and Ralph did a very good job with the subject. They spoke with a few local geologists and Roland Middleton with County Public Works. Roland has been the County a long time and was formerly in the Planning Department. John and Ralph also have their own news archives to go through assembling past landslide events in Whatcom County (old news stories archives are an important landslide hazard resource).
There are and will be some very hard painful lessons associated with this horrible event. But one lesson should be for local communities to take a hard look at their own risks from landslides and perhaps other natural hazards and assess how those hazards are being approached. Hence, the story angle John and Ralph went with is very important and should be an angle local reports should take not just in Washington State but in any area with landslide potential. And news stories should be followed with a hard look at how these hazards are being approached by local government. What are the regulations? Are the landslides or other natural hazard areas identified? What are the public awareness programs? If people live in a hazardous area, What is being done to reduce that Hazard?
Wednesday, March 26, 2014
Thoughts on Media Storm and Postcards Of My Usual Work
The past few days I have had fair bit of media contact regarding the horrible landslide near Oso, Washington. The contacts have been local, regional, national and international. I will say that essentially all of the contacts were positive and reporters consistently asked very good questions and were working hard to understand the landslide as well as trying to get a grasp on how society deals with these risks.Those contacts and conversations as well as the event itself cause a great deal of thinking. Over the next few weeks I hope to work through some ideas with many other folks and will post a bit on the subject when the time permits. Poor reporters are always crunched with deadlines.
I have appreciated the diligence of the reports, but I have also appreciated the many kind emails and messages that found the posts on the landslide informative.
I'd do more now, but I do have projects to work on and business partner on sabbatical. Moore landslide geology and policy thoughts later, but off to the field for a bit. So a taste of my field work.
Yesterday I headed out a bit late yesterday for a variety of field projects and did a short visit to Samish Island on the way.

View of Lummi Island from Samish

Daffodils on the Skagit Flats while heading south and east

Glacial till in the drilling sampler

Dense advance glacial outwash
Tuesday, March 25, 2014
Seismic Signal From Oso/Hazel Landslide
Liem alerted me to the local seismic network and sent the Mach 22 seismic plot from the Jim Creek Station. A seismic signal was also recorded at the Cultus Station and Stanwood Station.

Seismic network from the Pacific Northwest Seismic Network
(Stanwood seems a bit far from Stanwood proper)

Jim Creek

Cultus Mountain

Stanwood
All three stations record two events at approximately the same time and at the same time that the landslide event was reported to have happened. If this signal is from the slide, it indicates that two separate events took place a few minutes apart.
I checked other stations a bit further afield and found no signal, further suggesting that the slide was the source of the seismic signal.
Monday, March 24, 2014
Stilliguamish Flowing again at Arlington
I am sure some clever hydrologists are estimating the volume of water that has been held back by the landslide. Based on the graph of the discharge at Arlington it appears the river was backed up for approximately 30 hours so I came up with 2,727 acre feet.

The good news it that it sounds like the river is finding a new path and the held back water will draw down in a steady manner, but will require the river to erode downward. Given the loose material and distance it was deposited over, I am optimistic there will not be a huge flood surge. The communities and public safety and public workers on the Stilly need a break. Weather wise things look not too bad either with weather models indicate the organized storm tracks will be well to the south.
Sunday, March 23, 2014
Aerial History and LiDAR of the Stilliguamish Blocking Landslide
Aerial and LiDAR images explain a great deal about the landslide that blocked the NF Stilly (geology-of-silliguamish-blocking-slide and arm-waving-notes-on-stilliguamish). The LiDAR particularly shows the extent of past sliding and the scale of the past landslides. This leads to policy issues, but I will save that for a later day or two or week.


This image is from 2003. As can be seen the river and slide area has shifted a bit westward. This image is before the slide that took place in 2006 that blocked the river channel in a very similar manner to the Nooksack River blocking event of 2014.


LiDAR is a great tool for assessing landslides. The bare earth images have made mapping large landslides and large landslide deposits an office exercise with focused field trips. The active slide area is easy to see, but there is so much more to be gleaned from the LiDAR in regards to scale.

This next LiDAR image pulls back away a bit to show the bigger picture of the slope stability of the area.

The larger red outlined area in the central portion of the image is from a much larger slide. The deposit area from that slide was even bigger than what is indicated, but the southern end has been eroded and removed by the river. It would be very interesting to know how old this slide is. And also might be informative to look at the geometry of the headwall area.
Geology of Stilliguamish Blocking Slide
This post is more on the lines of what is known about the geology of the slide area. This landslide area is well known and has been a big problem for the past roughly 20 years. This was very much like the Ledgewood Slide on Whidbey Island. When I heard about a blocking slide on the Stilly, I had two candidate locations in mind and this was the first one. I say this not to brag, but to emphasize that this particular slide is well known amongst geologists as well as fisheries and forestry policy wonks. I do not do much work in the Stilly, but last summer had some work near here and took a little side trip to check it out. My thought at the time was "Yikes, this is a bad slide."
 Geologic Map of the Sauk 1:100,000 Quadrangle.pdf
The above map shows the larger scale geologic features of the landslide area that blocked the Stilliguamish. Ql on the map noted by the yellow area with red dots are landslides. As can be seen there are a number of areas designated as landslides. A word of caution though. Not all landslide designations are the same and there is a bit of inconsistency on maps including this one. This is a 1:100,000 scale map so there is a lot of detail that can not be presented. That is true of the landslide units as well as other units on the map. This map is a big picture map that is a compilation of decades of work by many different geologists. Part of the Sauk map utilizes mapping I did in 1990 miles from this location. The area I mapped covered 150 square miles - I guarantee there was a lot of detail I did not cover, but even some of the detail I had on my map could not be included at the sale of this map sheet.
The geologic unit that is within the landslide area is mapped as Qvr (mustard green?). Qvr stands for Vashon recessional sediments. These sediments were deposited during the late stages of the last glacial period. During the late stages of the ice age the valley was filled with glacial derived meltwater sediment. River gradients were different at that time due to higher local sea level as result of the mass of the Puget ice lobe having pushed the crust downward. As the land rebounded the river gradients became steeper and the river incised down through the former valley fill creating steep side slopes in unconsolidated sediment - a recipe for landslides. That is particularly true when the river is hard up against the base of the steep slope as was the case at this recent big slide (and on the recent slide on the Nooksack).
I should add that one of the interesting features of the North Fork of the Stilly is that this valley was for a time occupied by the Sauk River (glacier-peak-and-sauk-stiiliguamsih).
A more detailed map of the slide area was completed by Dragovich and others (2003)

This map also shows extensive landslide areas. On this map the designation is Qls. The current slide is just part of a larger area along the valley that has indications of landslides.
If you click and enlarge the image, there are designations of units within the recent slide. The map indicates the slope is underlain by advance glacial lake sediments (Qgle). These sediments were deposited when the outlet to the valley was blocked by the advancing ice in the Puget Ice lobe that dammed the river forming a lake. The next unit up the slope is Qgtv. This is glacial till and was deposited directly by glacial ice when he ice advanced up the valley and covered the area approximately 16,000 years ago. Both of these units will be very hard and compact due to the mass of glacial ice that had compacted them. But the real trouble is from the units above these. As the glacial ice receded, a new lake formed by the blocking ice and a recessional glacial lake formed (Qgle). This unit was never compacted and on top that unit is a sandy layer. Picture the valley being filled clear across by these units and the floor of the valley being a couple or three hundred feet higher than it is today. The river (first the Sauk and NF Stilly combined and then latter just the NF Stilly) down cut and incised through these sediments. These two late glacial units are particularly susceptible to slope failures and have failed on multiple occasions at this location (https://slidingthought/north-fork-of-stillaguamish/ and http://www.stillaguamish.nsn.us/steelhead%20haven%20slide.htm) as well as elsewhere along the sides of the NF Stilly valley.
A final note. The work done on the 2003 map by Dragovich and others with the Washington State Department of Natural Resources is the kind of basic research that is so informative. The mapping program at the DNR has been outstanding and has been funded by both State and Federal funding. This kind of mapping is enormously important. How it is translated to public benefit is another matter.
The above map shows the larger scale geologic features of the landslide area that blocked the Stilliguamish. Ql on the map noted by the yellow area with red dots are landslides. As can be seen there are a number of areas designated as landslides. A word of caution though. Not all landslide designations are the same and there is a bit of inconsistency on maps including this one. This is a 1:100,000 scale map so there is a lot of detail that can not be presented. That is true of the landslide units as well as other units on the map. This map is a big picture map that is a compilation of decades of work by many different geologists. Part of the Sauk map utilizes mapping I did in 1990 miles from this location. The area I mapped covered 150 square miles - I guarantee there was a lot of detail I did not cover, but even some of the detail I had on my map could not be included at the sale of this map sheet.
The geologic unit that is within the landslide area is mapped as Qvr (mustard green?). Qvr stands for Vashon recessional sediments. These sediments were deposited during the late stages of the last glacial period. During the late stages of the ice age the valley was filled with glacial derived meltwater sediment. River gradients were different at that time due to higher local sea level as result of the mass of the Puget ice lobe having pushed the crust downward. As the land rebounded the river gradients became steeper and the river incised down through the former valley fill creating steep side slopes in unconsolidated sediment - a recipe for landslides. That is particularly true when the river is hard up against the base of the steep slope as was the case at this recent big slide (and on the recent slide on the Nooksack).
I should add that one of the interesting features of the North Fork of the Stilly is that this valley was for a time occupied by the Sauk River (glacier-peak-and-sauk-stiiliguamsih).
A more detailed map of the slide area was completed by Dragovich and others (2003)
This map also shows extensive landslide areas. On this map the designation is Qls. The current slide is just part of a larger area along the valley that has indications of landslides.
If you click and enlarge the image, there are designations of units within the recent slide. The map indicates the slope is underlain by advance glacial lake sediments (Qgle). These sediments were deposited when the outlet to the valley was blocked by the advancing ice in the Puget Ice lobe that dammed the river forming a lake. The next unit up the slope is Qgtv. This is glacial till and was deposited directly by glacial ice when he ice advanced up the valley and covered the area approximately 16,000 years ago. Both of these units will be very hard and compact due to the mass of glacial ice that had compacted them. But the real trouble is from the units above these. As the glacial ice receded, a new lake formed by the blocking ice and a recessional glacial lake formed (Qgle). This unit was never compacted and on top that unit is a sandy layer. Picture the valley being filled clear across by these units and the floor of the valley being a couple or three hundred feet higher than it is today. The river (first the Sauk and NF Stilly combined and then latter just the NF Stilly) down cut and incised through these sediments. These two late glacial units are particularly susceptible to slope failures and have failed on multiple occasions at this location (https://slidingthought/north-fork-of-stillaguamish/ and http://www.stillaguamish.nsn.us/steelhead%20haven%20slide.htm) as well as elsewhere along the sides of the NF Stilly valley.
A final note. The work done on the 2003 map by Dragovich and others with the Washington State Department of Natural Resources is the kind of basic research that is so informative. The mapping program at the DNR has been outstanding and has been funded by both State and Federal funding. This kind of mapping is enormously important. How it is translated to public benefit is another matter.
Saturday, March 22, 2014
Arm Waving Notes on the Stilliguamish Blocking Landslide
Saturday morning a large pre existing landslide let loose on the Stilliguamish River. This slide has caused trouble before, but this time it has proven to be fatal with three killed and several injured. This failure was at a much larger scale than previous events and has blocked the river. This blockage is much more serious than the recent short duration blockage on the Nooksack River a few weeks ago. Strongly worded evacuation orders have been issued for downstream residents.

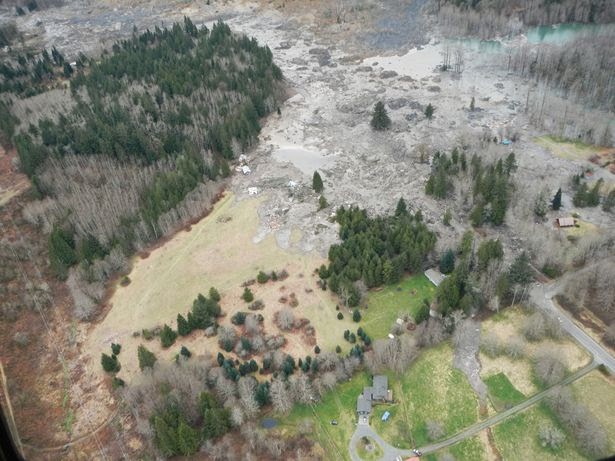
Image of landslide viewed from the south looking north up from the Stilliguamish Valley
(photo, Snohomish County)

View of landslide deposit (Snohomish County)
View is from the north looking south down to the valley floor
State highway is buried along the lower edge of thick patch of trees
The pooled water of the Stilliguamish River can be seen on left
The river flow is from left to right
Landslide deposit (Snohomish County)
View is from the east looking west down the valley just upstream of the slide
Highway can be seen on lower right.
Brown strip on left is he electric power transmission line corridor
It appears that the river is pooling and beginning to flood areas beyond the slide area.

Google earth image of landslide area
I marked the outer edge of part of the slide deposit from the Snohomish County photos.
AERIAL VIEW
Seattle Times has some excellent perspective pictures: http://seattletimes.com/html/photogalleries/localnews2023201892/
I'll likely have more later. This slide will be well covered by the news and I am sure a variety of agency folks will provide some good rapid response assessments. I'll add some bits as I see appropriate.
What I will add now though:
1) News coverage is a bit odd as news helicopters from news stations in Washington State have been grounded due to a news helicopter accident.
2) People really should be forced to evacuate under these conditions. A river dam burst flood is not something you want to be in. Life is more important than possessions.
3) This slide was a preexisting problem. There was concern that it would block the river a few years ago. Landslide wonks knew exactly where this slide was as soon as it made the news. I looked at this slide area last summer. It was clearly bad news then and with very heavy multiple rain events the past six weeks landslides - particularly big ones are not a surprise.
Air Quality: Coal Trains and Then the Bad News
A bit of catch up on posts. A study by Jaffe and others (atmospolres/Volume5/issue2/APR, 2014.pdf) on trains and coal train emissions measured short term emissions of particulates. One noteworthy finding is that their measurements indicate that coal dust is being released from passing coal trains. The particulates add to the diesel exhaust particulates from the train engines themselves. The study was of very limited scope and concludes with a few suggestions for further investigation.
John Stark covered this issue rather well first with the pro coal terminal reaction and the counter reaction (coal-terminal-backers-challenge-researchers-dust-findings). Claiming no coal dust is coming off the trains with no studies is just spin. Stark also reported on the local Northwest Clean Air Agency (NWCA) study with a monitor located very near the rail lines in Bellingham (air-agency's-monitor-shows-no-emissions-problems). That investigation indicates good overall air quality on all days but 5 from February 2012 to September 2013.
The NWCA reporting and the Jaffe and others study are apples and oranges. NWCA reports a daily average as that is what is used to determine health effects. Jaffe and others did a bit harder short time frame measurement that allowed discerning particulate levels changes while individual trains were passing. Jaffe and others found coal trains have a greater release of particulates, but the NWCA study suggests, at least at this one spot, the overall air quality impacts are not bad at current train traffic levels despite whatever impacts the coal dust release might have. The NWCA reports that the daily average air quality at the location monitored was good on all but 5 days. The few not so good days were related to air stagnation that impacted the other monitoring site in Bellingham (Yew Street) even more. Good news for Bellinghamsters - particularly those living closer to the water. Bellingham has great air quality.
But looking at the daily averages reveals a bit about air quality in northwest Washington. The bad particulate air is nowhere near the railroad tracks.

The January 2013 air in Bellingham at the Cornwall site hear the railroad tracks was good every day. A few moderate days at the Bellingham Yew Street site. But the Columbia Valley site located in the Northwest Cascades between Sumas Mountain and Red Mountain had few good days and lots of days with unhealthy air.
The confined nature of the valley combined with winter temperature inversions and lots of readily available firewood bring about some of the worst if not the worst air quality in Washington State. There are no towns in the valley, but the valley has an urban growth area. The urban area was the result of a couple of semi failed recreational developments that turned into year round residential developments. The community is fairly poor and has a cold climate requiring heating, with wood being preferred by many.
John Stark covered this issue rather well first with the pro coal terminal reaction and the counter reaction (coal-terminal-backers-challenge-researchers-dust-findings). Claiming no coal dust is coming off the trains with no studies is just spin. Stark also reported on the local Northwest Clean Air Agency (NWCA) study with a monitor located very near the rail lines in Bellingham (air-agency's-monitor-shows-no-emissions-problems). That investigation indicates good overall air quality on all days but 5 from February 2012 to September 2013.
The NWCA reporting and the Jaffe and others study are apples and oranges. NWCA reports a daily average as that is what is used to determine health effects. Jaffe and others did a bit harder short time frame measurement that allowed discerning particulate levels changes while individual trains were passing. Jaffe and others found coal trains have a greater release of particulates, but the NWCA study suggests, at least at this one spot, the overall air quality impacts are not bad at current train traffic levels despite whatever impacts the coal dust release might have. The NWCA reports that the daily average air quality at the location monitored was good on all but 5 days. The few not so good days were related to air stagnation that impacted the other monitoring site in Bellingham (Yew Street) even more. Good news for Bellinghamsters - particularly those living closer to the water. Bellingham has great air quality.
But looking at the daily averages reveals a bit about air quality in northwest Washington. The bad particulate air is nowhere near the railroad tracks.
The January 2013 air in Bellingham at the Cornwall site hear the railroad tracks was good every day. A few moderate days at the Bellingham Yew Street site. But the Columbia Valley site located in the Northwest Cascades between Sumas Mountain and Red Mountain had few good days and lots of days with unhealthy air.
The confined nature of the valley combined with winter temperature inversions and lots of readily available firewood bring about some of the worst if not the worst air quality in Washington State. There are no towns in the valley, but the valley has an urban growth area. The urban area was the result of a couple of semi failed recreational developments that turned into year round residential developments. The community is fairly poor and has a cold climate requiring heating, with wood being preferred by many.
Friday, March 21, 2014
Costs of Heavy Lowland Snow
Earlier in March northwest Washington (mostly Whatcom County) had a fairly heavy snow storm. The snow began with temperatures just a bit above freezing. It was a wet heavy and very sticky snow and finished off with a bit of freezing rain. This particular snow event did a great job of sticking to tree branches and total snow from the single storm was in the 8 to 12 inches range.

Mid storm view in Bellingham
The result of the storm was some tree damage. There was the usual power outages in rural and some city areas as lines were broken by the mass of snow and trees leaned or broke lines down.
The event also has some costs to forestry. I did not observe any notable damage to conifers from this event, but did observe a number of broken big leaf maple and red alders. The red alders were particularly susceptible as they grow at angles towards light. That growth habit did a fair job of block forest roads

Another cost impact of down limbs and trees is to the local diking districts. The districts need to maintain a drive-able surface along the top of levees. The red alders and cottonwoods along this reach of levee will require a bit of work to clear.

Nooksack River levee near Lynden

Monday, March 17, 2014
A Wee Bit of Geology, History and Music from the Ancient Tribal Homeland
Stuff requiring attention of late so thin on posts. But here is a bit from the ancient tribal homeland for the day.

Cliffs of Moher - checking out 300 million year old shale and sandstone

Skellig Michael and Devonian alluvial sediments (350 million)

Blanket bog erosion likely from over grazing

The Burren - limestone dated at 350 million years
Top soil lost possibly due to grazing and climate change

Poison Glenn in Donegal with classic glacial landscape

Major tectonic boundary near Westport

The Bogside Neighborhood or the Catholic part of Derry (Londonderry for the Orange)

Blood Sunday mural in Derry when the Troubles really spread
And a little music from some favorites:
Tuesday, March 11, 2014
A Too Short Break on a Bald
I had a bit a of field blitz hitting a few far flung sites that I wrapped up today. Today was Spring with warm sun.

Sunday, March 9, 2014
John Mix Stanley in the Oregon Country

Buffalo Hunt on the Southwest Prairie
1946
John Mix Stanley
Visiting the Smithsonian American Art Museum I noted this painting by John Mix Stanley. George Catlin is the much better known painter of Indians in the 19th Century, but Catlin never traveled to what is now Washington State. Stanley did travel to the Oregon County as it was then known and may have equaled Catlin except for some very bad luck.
Like Catlin Stanley wanted to capture what he viewed as fast disappearing cultures.
". . . a few generations hence our descendants will have nothing, except . . . memorials, to remind them of the former existence of a race, which had made perhaps a more gallant and prolonged defense of their independence, than any recorded in the widespread annals of warfare between savage and civilized men." - John Mix Stanley, 1852
After his initial trips to the Southwest, Stanley traveled north to the Oregon Country. His work from that trip was displayed at the Smithsonian and he became acquainted with Isaac Stevens at that time. He joined Stevens on the Northern Pacific Railway Expedition as a paid artist to help illustrate the scientific and survey work and it is that work that survives.

Old Fort Walla Walla, 1853
From the Northern Pacific Railway Expedition
The view is down Wallula Gap from near the mouth of the Walla Walla River
After that expedition Stanley produced a large body of work of images and paintings of Indians including presumably Northwest Indians. Alas, most of his work was destroyed in a fire at the Smithsonian in 1865. He then had further bad luck when a large collection of his work was lost in the fire that burned Barnum's_American_Museum. With those loses, we lost some of the earliest images of the Pacific Northwest.

J.M. Stanley self portrait
courtesy National Anthropological Archives, Smithsonian Institution
Saturday, March 8, 2014
A Brief History of Squalicum Creek Valley
The landscape of the western Washington low lands is full of valleys with undersized streams. That is, the existing stream in the valley did not erode the valley. Some past larger water flow carved the valley that is now occupied by a rather smallish stream. Many of these valleys were formed during the late stages of the last glacial period as ice retreated from the western Washington low lands. Large rivers diverted by glacial ice carved deep valleys and then found new routes as the ice retreated and opened up new paths for water flow.
A great example of one of these valleys is just north of Bellingham. It is a rather pretty valley with a mix of mature second growth forest and pastures without too much in the way of rural sprawl so it has maintained its rural character despite its proximity to Bellingham.

View of Squalicum Valley from Van Wyck Road
The above view is actually a section of the valley upstream of Squalicum Creek proper
This valley shows up even on topographic maps as an obvious glacial river channel, but LiDAR imagery makes an even clearer picture.

A river incised down through the landscape when the ice margin was a bit north of Bellingham. Perhaps it was a river of melt water issuing from the margin of the glacier or it may have been a diverted Nooksack River. The Nooksack currently flows from southeast to northwest across the northeast comer of the image. If the river had been present its path would have been blocked by the ice and diverted southward to what is now Bellingham.
Additional channels of similar size can be seen to the north of Squalicum Creek. These too were formed by past larger volumes of water as the glacial margin retreated further to the north. (There has been suggested ideas of readvancing ice as an explanation as well, but that idea has been loosing favor of late).
Just northwest of the name Bellingham on the LiDAR image, the valley fades away and a narrower valley continues to Bellingham Bay (the squarish cut out is an old gravel mine). This area was formerly a delta area and suggests that the large Squalicum Creek valley was formed when local sea level was substantially higher than present as the area had yet to rebound from the mass of glacial ice. I came across some marine fossils very near Squalicum Creek in Bellingham (tube-worms-in-bellingham-drift). As rebound took place Squalicum Creek down cut through the rising terrain.
The comparison of the upper broad deep valley with the lower narrow valley is informative. The existing lower valley carved by Squalicum Creek is dwarfed by the much larger valley it occupies upstream. Squalicum Creek has occupied the lower valley for something on the order of 12,000 years. The upper valley was likely carved over a period of less than 1,000 years and perhaps even less than 100 years.
Friday, March 7, 2014
Random Geology While in the Field
A fair bit of my geology work could be described as a bit random (sort of like my blog posts). My field work is dictated by where projects take me. There is no inherent focus on solving some great geologic puzzle. Just an accumulation of random observations that sometimes may coalesce into a bigger picture understanding. And some observations though interesting to me, may have no relevance to the reason I am at a location. These later observations allow me to do a little theory with no worries about being right or wrong. Such was the case at the mouth of a small river on the Olympic Peninsula.
Black horizons within the soil profile caught my attention at the top of the beach.

The stratum suggests that this location is a sediment accumulation location with previous organic horizons having been buried. However, the site is currently eroding.


Its easy to see that this spot would be susceptible to erosion as this section of shore is open to the ocean via the Strait of Juan de Fuca.

So Why the organic soil horizons? Theories: 1) big floods on the river buried the site with sand and gravel, 2) large storm waves took delta gravel and built a berm over older poorly developed soil horizons on multiple occasions, 3) tsunamis, 4) some sort of anthropogenic actions in the past.
Lots of tests to do to figure out the problem and rule out the various theories. The answer? Not resolved like may of my observations. I had other things to do that needed to be resolved and did not have time to work through all the theory tests or even what the tests should be or even if I had enough theories.
That said I like the idea of past storm waves piling up gravel and sand in a berm on multiple occasions. The site is now being eroded due to a lack of big waves that push sediment across the mouth of the river or the available sediment that would be moved by the waves is no longer present. I went with no on tsunamis as it seems thin organic zones in the sand and gravel would with plenty of air would not last. That said this location would have certainly been inundated. The big flood idea was ruled out as there was lack of evidence of large enough floods up stream along the river. That part of the project was looked at closely. I could not rule out the anthropogenic part as I did find some historic references to this location that suggested a lot more went on here than today. But those activities were over 100 years ago and Why would there be multiple burials of soil?
Another observation sort related to the above was the presence of glacial till just below the veneer of river gravel and shore transported cobbles at the mouth of the is river.

This smallish river has not built up much of a delta as wave action readily transports gravel and cobbles along the shore to the east. Sort of a surprise to see and files away to perhaps become part of a greater understanding if I can connect this observation with something else.
Subscribe to:
Posts (Atom)


